
Web Core Vitals are measured in the following important parameters.
Largest Contentful Paint (LCP)
First Input Delay (FID)
Total Blocking Time (TBT)
Cumulative Layout Shift (CLS)
First Contentful Paint (FCP)
Time to Interactive (TTI)
Speed Index
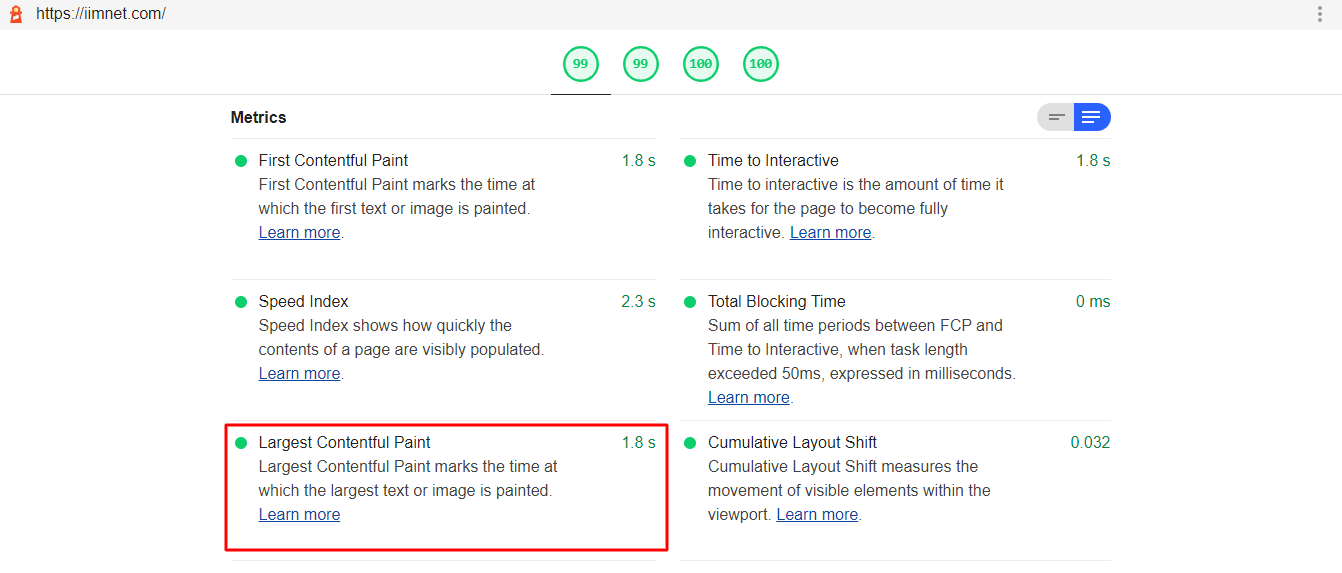
Largest Contentful Paint marks the time at which the largest text or image is painted.
| LCP time (in seconds) | Color Coding |
|---|---|
| 0 - 2.5 | Green (fast) |
| 2.5 - 4 | Orange (moderate) |
| Over 4 | Red (slow) |
Reduce CSS Blocking Time
Reduce JavaScript Blocking Time
1. Minify CSS: For better understanding, CSS files can contain characters such as spacing, indentation, or comments. These characters are all unnecessary for the browser, and minifying these files will ensure that they will get removed. Remove any unused CSS entirely or move it to another stylesheet if used on a separate page of your site.
2. Inline Critical CSS: Inline any CSS used for above-the-fold content by including it directly in "head" tag.
Download the javascripts like bootstrap, jquery etc rather than directly fetching from the CDN links. Now combine all the javascripts and minify the file.
Improve web core vitals score by Lazy loading javaScript ➞FID measures interactivity. To provide a good user experience, pages should have a FID of 100 milliseconds or less. Some of the google tools use TBT instead of FID. To predict FID, Total Blocking Time (TBT) is recommended. They measure different things, but improvements in TBT usually correspond to improvements in FID.
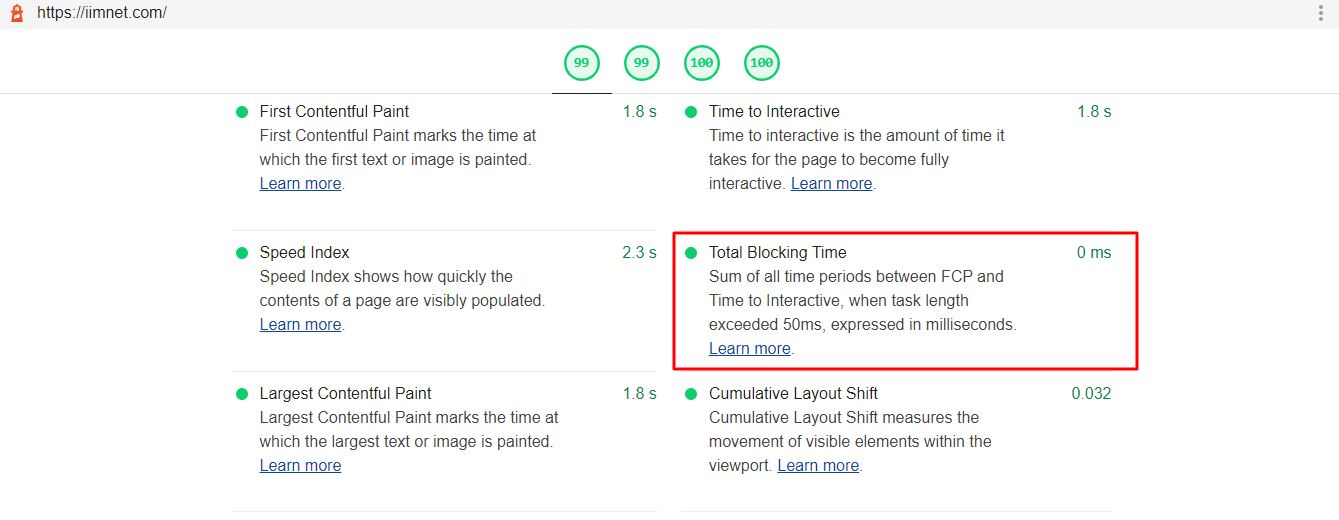
TBT measures the total amount of time that a page is blocked from responding to user input, such as mouse clicks, screen taps, or keyboard clicks. Any task that executes for more than 50 ms is a long task. The amount of time after 50 ms is the blocking portion.
| TBT time (in milliseconds) | Color Coding |
|---|---|
| 0 - 300 | Green (fast) |
| 300 - 600 | Orange (moderate) |
| Over 600 | Red (slow) |
Unnecessary JavaScript loading. Remove all the unnecessary javascript to improve TBT.
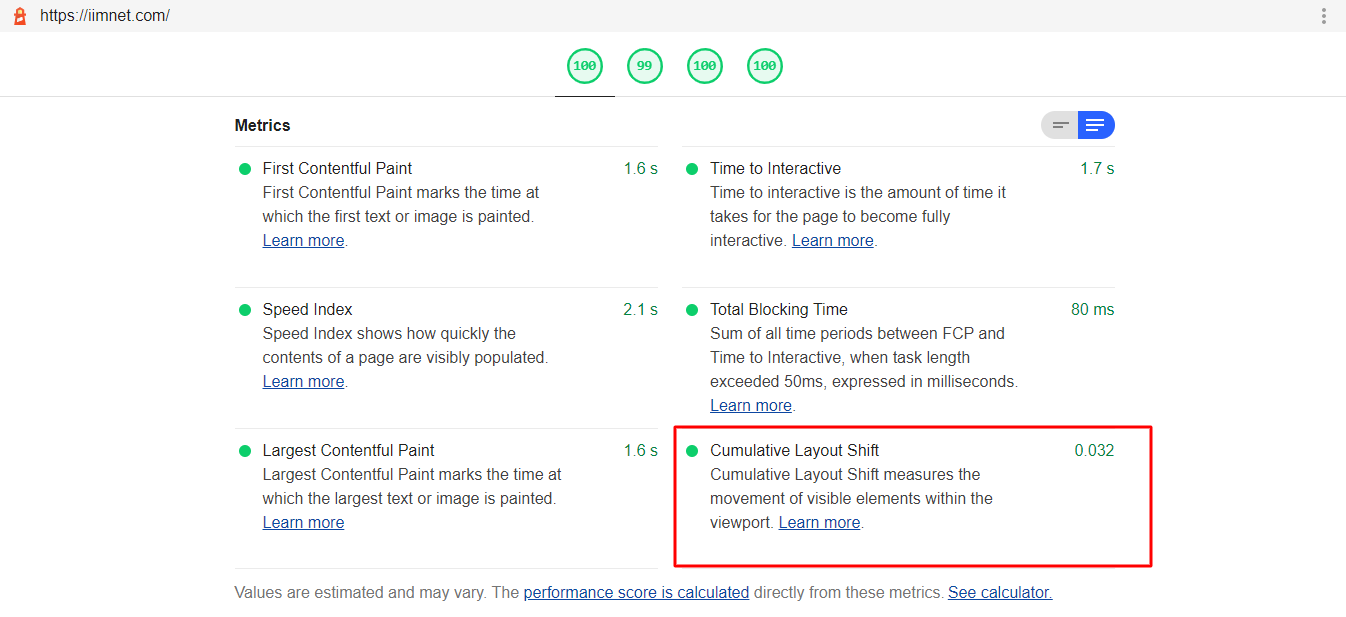
CLS measures visual stability. Unexpected movement of page content usually happens because resources are loaded asynchronously or DOM elements get dynamically added to the page above existing content.
| CLS | Status |
|---|---|
| ≤0.1 | Good |
| >0.25 | Poor |
1. Use size attribute dimensions for any media: Always include size attributes on your images and video elements. This will assign a certain amount of space until the image loads.
2. Reserve space for ad elements: Make sure ads elements have a reserved space. Otherwise they can suddenly appear on the page, pushing content down, up or to the side.
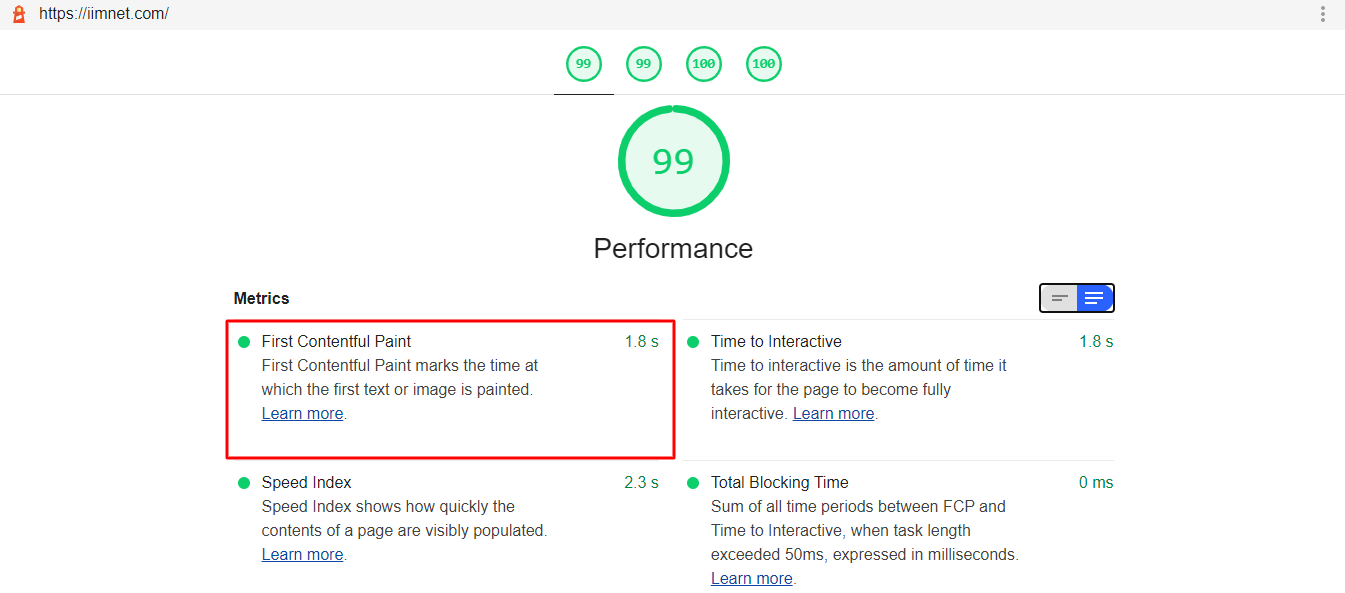
Improve web core vitals score by lazy loading images ➞FCP measures how long it takes the browser to render the first piece of DOM content after a user navigates to your page. Images, "canvas" elements, and SVGs on the page are considered DOM content. Anything inside an iframe is not included.
| FCP time (in seconds) | Color Coding |
|---|---|
| 0 - 2 | Green (fast) |
| 2- 4 | Orange (moderate) |
| Over 4 | Red (slow) |
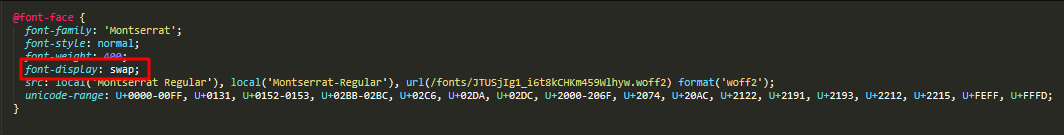
One issue that is important for FCP is font load time. Load the fonts from the local storage i.e., Download the fonts and use them using @font-face instead of giving the CDN links.
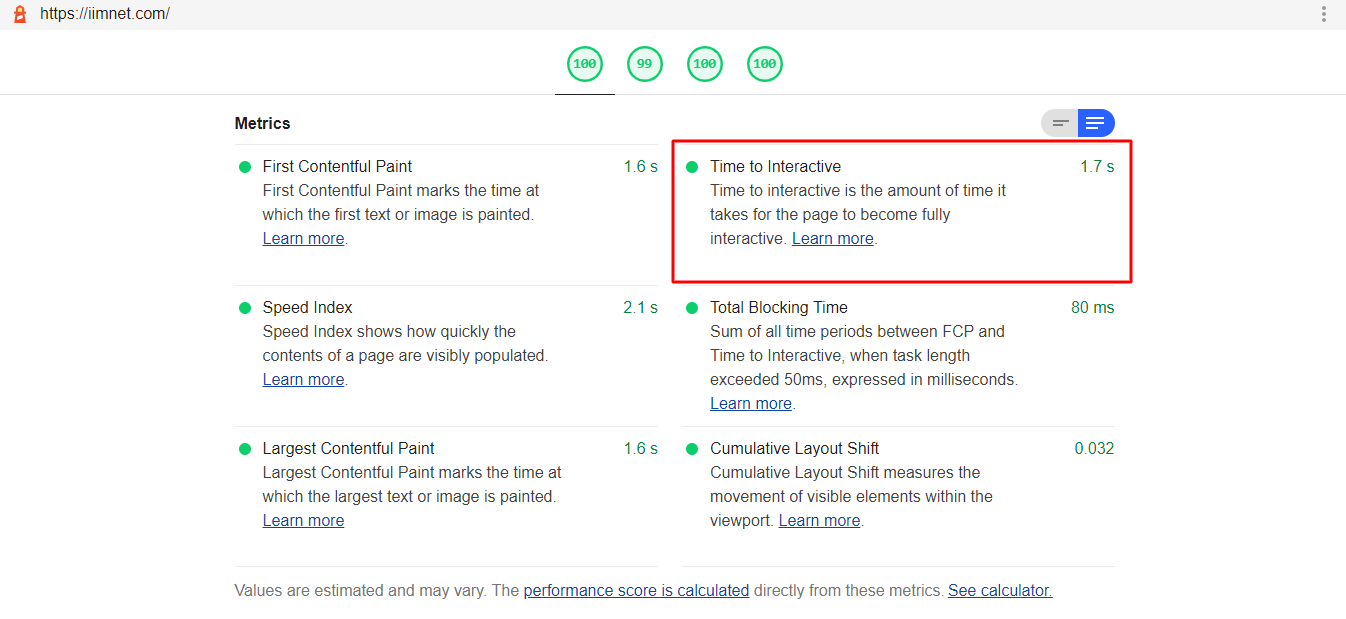
TTI measures how long it takes a page to become fully interactive. A page is considered fully interactive when:
The page displays useful content, which is measured by the First Contentful Paint
The page responds to user interactions within 50 milliseconds
| TTI time (in seconds) | Color Coding |
|---|---|
| 0 - 3.8 | Green (fast) |
| 3.9 - 7.3 | Orange (moderate) |
| Over 7.3 | Red (slow) |
1. Minimize main thread work: Optimize third-party javascripts.
1. Reduce JavaScript execution time: Remove unused scripts which are not required for the website.
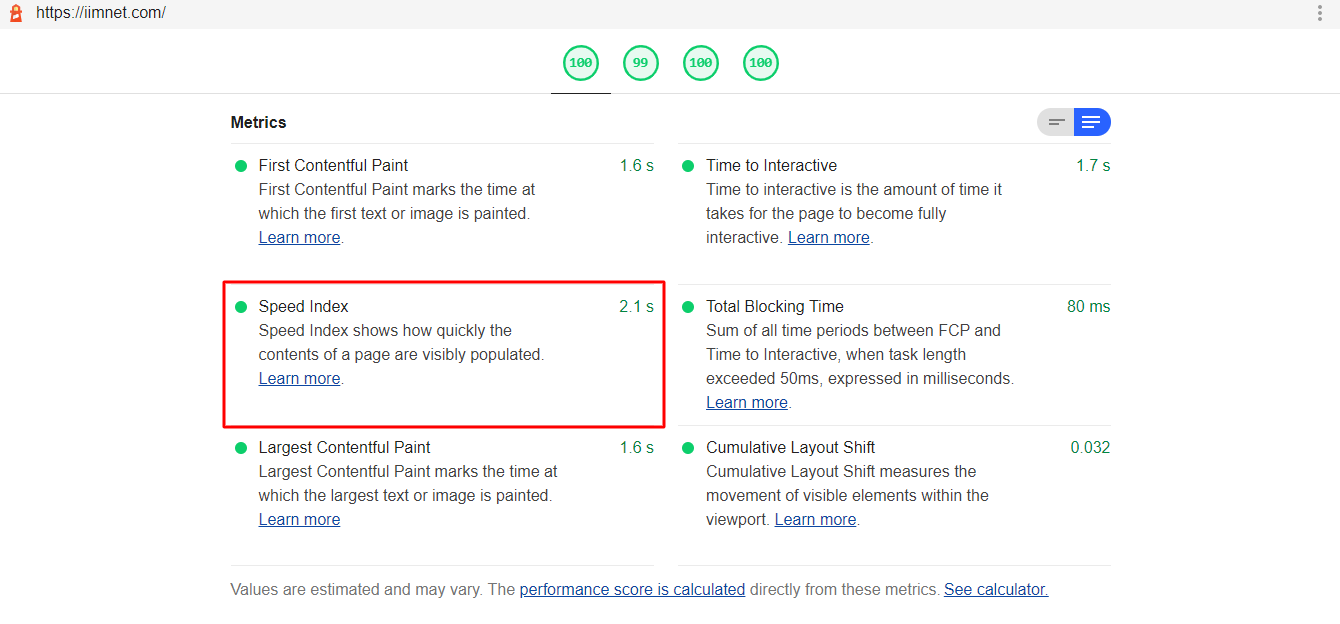
Speed Index measures how quickly content is visually displayed during page load. Lighthouse captures a video of the page loading in the browser and computes the visual progression between frames.
| Speed Index (in seconds) | Color Coding | Score |
|---|---|---|
| 0 - 4.3 | Green (fast) | 75 - 100 |
| 4.4 - 5.8 | Orange (moderate) | 50 - 74 |
| Over 5.8 | Red (slow) | 0 - 49 |
Minimize main thread work
Reduce JavaScript execution time
Ensure text remains visible during webfont load
NectarSpot Inc. is an integrated digital marketing company specializing in Design & Development of Web, Mobile & Voice Applications.
Our award winning team excels in providing redesign, optimization, automation, and analytics services to companies at various growth stages.
Contact us today to get your project started.


Copyright © 2026 Website by NectarSpot Marketing, Automation, and Design Company