Data Visualization (Data Viz) and Analytics is science of analytical reasoning made possible by the use of interactive visual interfaces. Our team of data scientists and analysts execute projects in data visualization as – visual interrogation of data, looking for abnormalities, gaps, clusters, and data patterns.
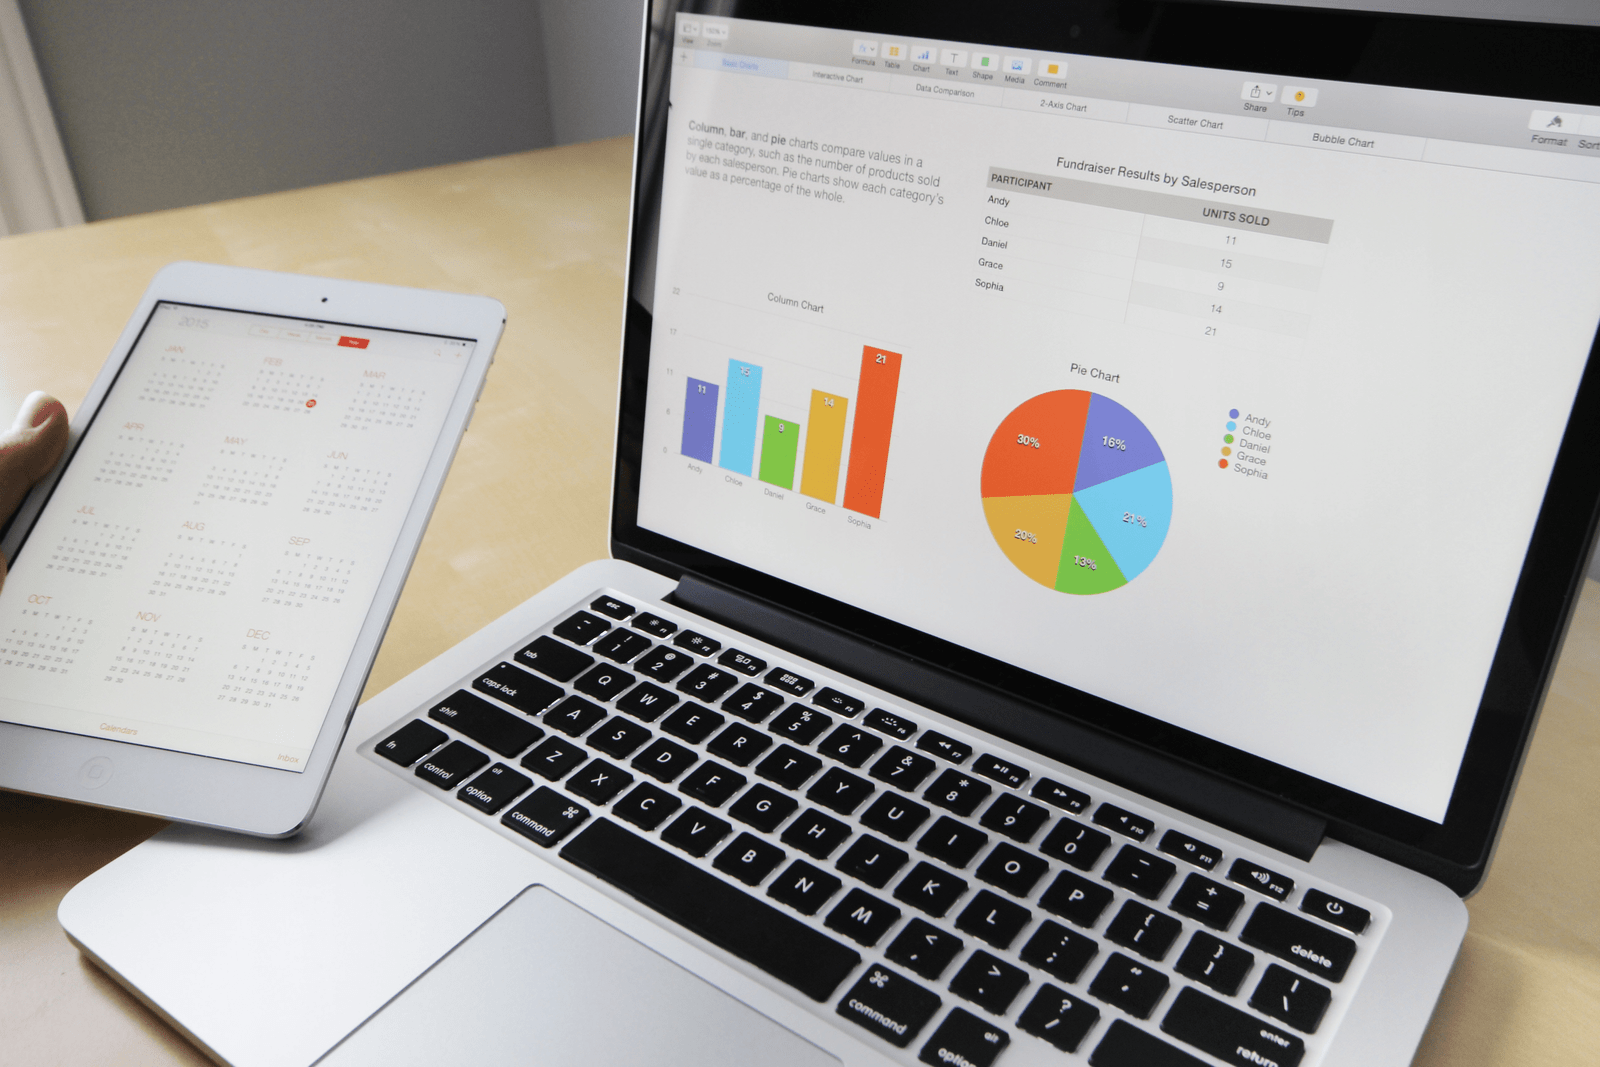







We help you to transform your organization’s data into rich visuals for you to make right decisions (at right time before it’s too late):
Spot Trends as they happen.
Find what effects your Top-Line.
Stay in the Know through Data Board.
Get insights on Bottom-Line Performance.
Understand Trends, Patterns and make correlations
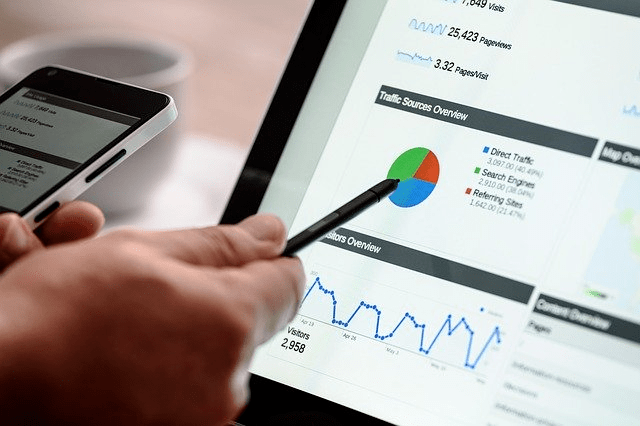

Clickstream data is an information trail a user leaves behind while visiting a website or your mobile App. It is typically captured in semi-structured website log files and capturing events.
Our data science team refine and analyze clickstream data, over a period of time, using various tools and frameworks. They then answer business questions such as:
What is the most efficient path for a site visitor to research a product, and then buy it?
What products do visitors tend to buy together, and what are they most likely to buy in the future?
Where should I spend resources on fixing or enhancing the user experience on my website?
From Google Data Studio installations to Big Data Visualization projects, NectarSpot is a data-driven marketing agency that works hard to find insights and patterns in your sales and marketing data.
The Data Visualization team at NectarSpot provides that inside knowledge as to how to design that effective and visual marketing dashboards, how to aggregate insights into exciting, visual reports, and how to choose the most effective metrics to communicate in their presentations, in their stories.










Copyright © 2026 Website by NectarSpot Marketing, Automation, and Design Company