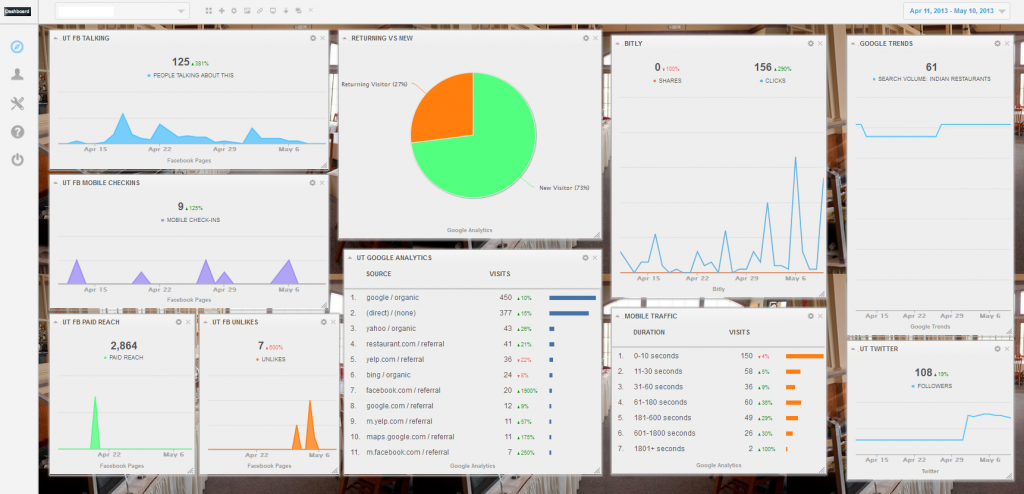
A business dashboard is an information management platform that is used to track KPIs (Key Performance Indicators), business metrics, and other key data points relevant to an organization, business unit, or support function(s). Through the use of data visualizations, dashboards simplify complex data sets to provide business and technical users with at a glance awareness of current performance so they can act to further optimize or take corrective actions (in case of deviation from preset objectives).

In today’s environment data is everywhere – sales, marketing, social, paid media, owned media, IT operations, HR and others. Managing and extracting real value from all that data is a key challenge facing executives at all levels in organization starting from an analyst at lowest rung of business hierarchy , managers and CXOs. In seeking a way to simplify data analysis and distribution, executives (across all business hierarchy) often find themselves quickly dealing with data and information overload.
Since inception of NectarSpot , we design and implement business dashboards to simplify business’s complex processes into manageable, digestible chunks of information so business executives can focus on other strategic and tactical activities that impact their top-line and bottom-line metrics.
“A well designed business dashboard is a remarkable management tool for an executive to take smart strategic and tactical decisions”
A well designed dashboard use can have a positive impact on business top-line and bottom-line performance.
A near real-time dashboard which is aligned with key business objectives keeps everyone abreast with single version of truth and put the most important metrics about your business where they can have most impact. With 10+ years of designing and implementing dashboards for enterprises, we have found out three common and effective business cases for dashboards:
Invariably we all agree that data is one of the most valuable assets owned by your business. Converting this data to meaningful information, however, is often more difficult in practice. A well designed visual dashboard has the ability to inform business executives across the organization hierarchies and provide on-demand access to core business metrics. With single version of truth available on your desktop, mobile and digital displays now everyone on your team can use a dashboard to run a better business!
Your business needs to get insights from various business units and functions and hence naturally you need to gather data from multiple touch points. A well designed and smart platform (on which dashboard is built upon) reduces the amount of time and effort compiling data often housed in different formats (for e.g. xml vs JSON), signing into multiple analytics services ( for e.g. Salesforce, Google Analytics and others), and thus helping your analysts reduce their time and effort from manual tasks of collecting and preparing (often called ‘data wrangling’) unruly digital data before it can be explored for useful nuggets of insights.
* As per NYT, Data Scientists spend 50-80% of their time mired in mundane labor of collecting and preparing unruly data.
As your business grows, your inter-departmental activities (read politics) tend to increase exponentially. Dashboards provide an objective view of current performance and can effectively serve as common ground for further dialogue and alignment. For instance, executives in sales and marketing team may need alignment over the customer acquisition process. Dashboards can surface metrics that are relevant to each team in a way that is mutually understandable and agreeable during design phase.
During design phase, to help our customers decide what kind of graphs are needed (as per different kind of business metrics to monitor), our consulting team refers ‘S.M.A.R.T’ Goal as per the following

We help businesses to build business dashboards by connecting via APIs or “application programming interfaces,” with most of your systems you currently use, for e.g. accounting software, your customer relationship management (CRM) system, your email system, your website analytics platforms, etc.
Dashboard built on our platform pulls almost all this information into one place so you don’t have to log into multiple systems. It can also manipulate this data so the information is in a more accessible format and visible to executives at various hierarchies.
Copyright © 2026 Website by NectarSpot Marketing, Automation, and Design Company